Tables
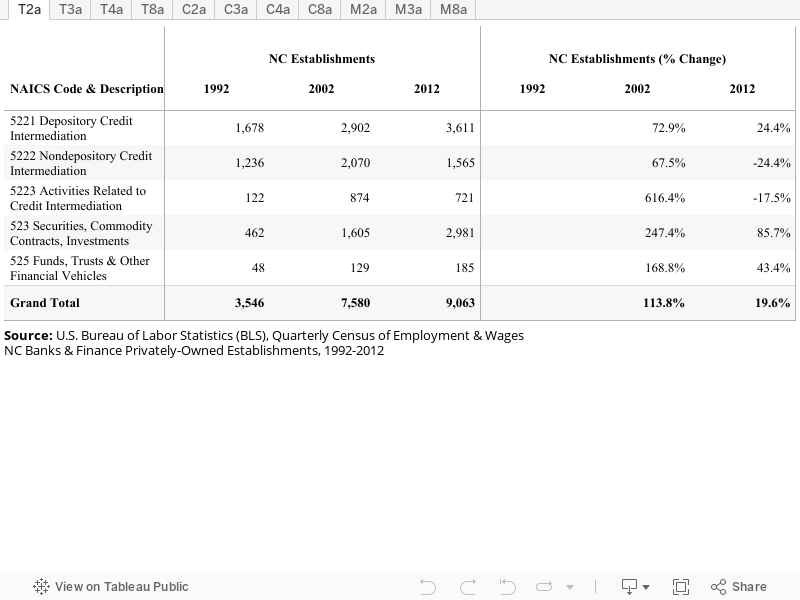
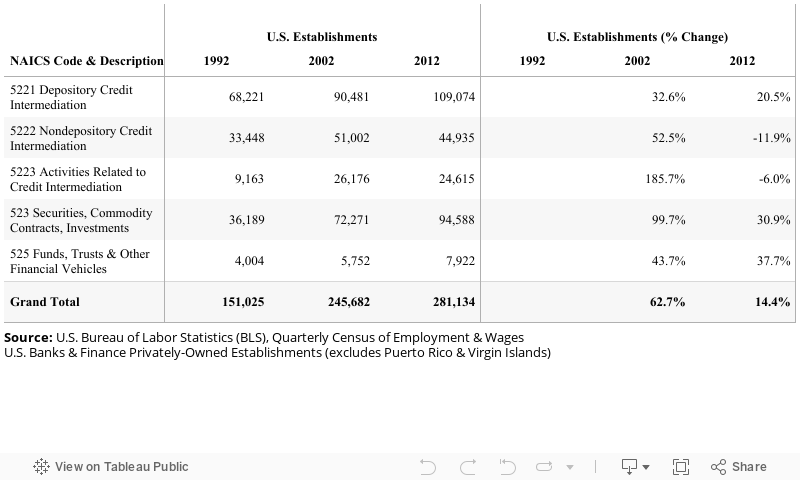
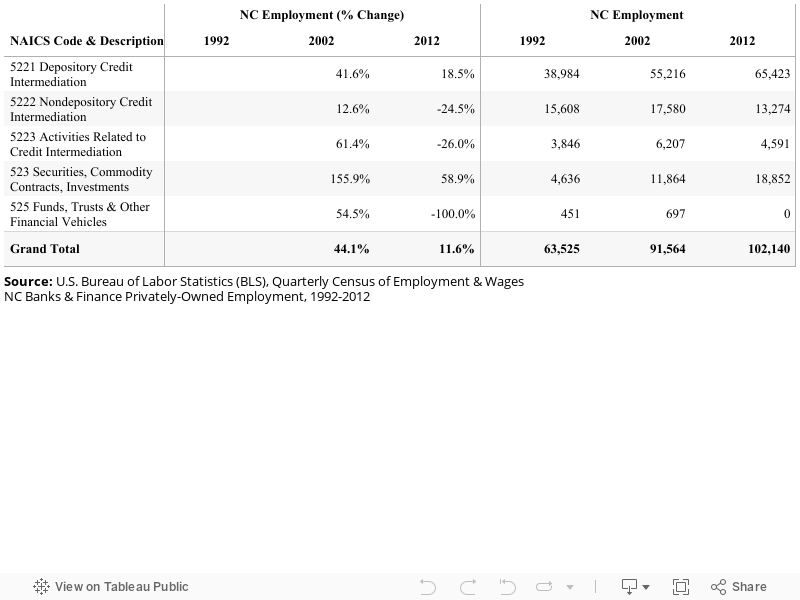
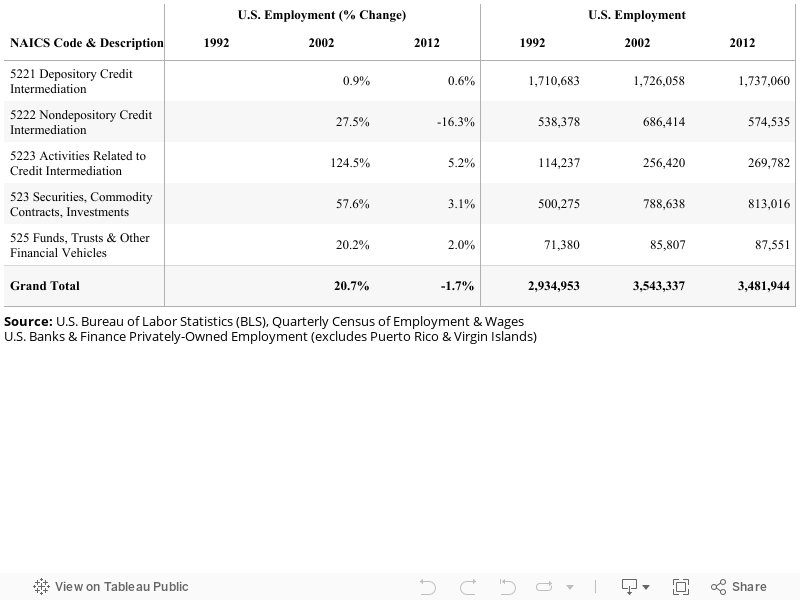
This page includes data in table format on various topics for the banks & finance industry. These tables are referenced with hyperlinks throughout the other sections of this industry, but are also all listed here for comparative purposes. The labeling system for the tables, charts and maps is the same for each industry in which information is available: establishments (T2), employment (T3), average annual wages (T4), and layoffs/plant closings (T8) for North Carolina (Table "a"), the United States (Table "b") and top U.S. states (Table "c''). See the “Website Overview” for more details.
Banks & Finance: Table 1a: NC Top Employers
| Rank | Company Name | Headquarters | Primary NAICS | NC Employment | Total Employment | Total Sales ($US Mil) |
|---|---|---|---|---|---|---|
| 1 | Wells Fargo & Company | San Francisco, CA | 522110 | 27,200 | 269,200 | $91,247 |
| 2 | Bank of America Corporation | Charlotte, NC | 522110 | 19,000 | 267,000 | $84,235 |
| 3 | BB&T Corporation | Winston Salem, NC | 522110 | 13,000 | 34,000 | $10,737 |
| 4 | First Citizens BancShares | Raleigh, NC | 522110 | 4,300 | 5,076 | $1,446 |
| 5 | PNC Financial Services Group | Pittsburgh, PA | 522110 | 4,200 | 56,285 | $16,606 |
| 6 | Credit Suisse Group AG | Zürich, Switzerland | 522110 | 1,350 | 47,400 | $42,587 |
| 7 | The Vanguard Group | Malvern, PA | 522130 | 1,350 | 12,000 | $1,122 |
| 8 | Conbraco Industries | Matthews, NC | 334515 | 1,115 | 1,115 | $N/A |
| 9 | First Bancorp | Troy, NC | 522110 | 786 | 867 | $154 |
| 10 | Thomson Reuters LLC (Thomson Company) | Morehead City, NC (Toronto, Canada) | 523930 | 677 | 55,000 | $4,131 |
| 11 | Tree.com, Inc. | Charlotte, NC | 522310 | 670 | 174 | $77 |
| 12 | Fifth Third Bancorp | Cincinnati, OH | 522110 | 639 | 20,798 | $7,106 |
| 13 | First Horizon National Corporation | Raleigh, NC (Memphis, TN) | 522310 | 445 | 4,498 | $1,470 |
| 14 | Federal Reserve Bank (The Board of Governors of the Federal Reserve System) | Charlotte, NC (Washington, DC) | 522110 | 370 | 21,000 | $479 |
| 15 | Truliant Federal Credit Union | Winston Salem, NC | 522130 | 275 | 480 | $63 |
Sources: Dun & Bradstreet’s Hoover’s Online Pro database, secondary news sources and personal communication. Total sales and total employment represent data for the entire corporation. See the FAQ question for additional details.