Charts
This page includes data in chart format on various topics for the tobacco industry. These charts are referenced with hyperlinks throughout the other sections of this industry, but are also all listed here for comparative purposes. The labeling system for the charts is the same for each industry in which information is available: establishments (C2), employment (C3), average annual wages (C4), exports (C6), imports (C7) and layoffs/plant closings (C8) for North Carolina (Chart "a"), the United States (Chart "b") and top U.S. states (Chart "c''). See the “Website Overview” for more details.
Tobacco: Chart 2a: NC Establishments: 1992-2012
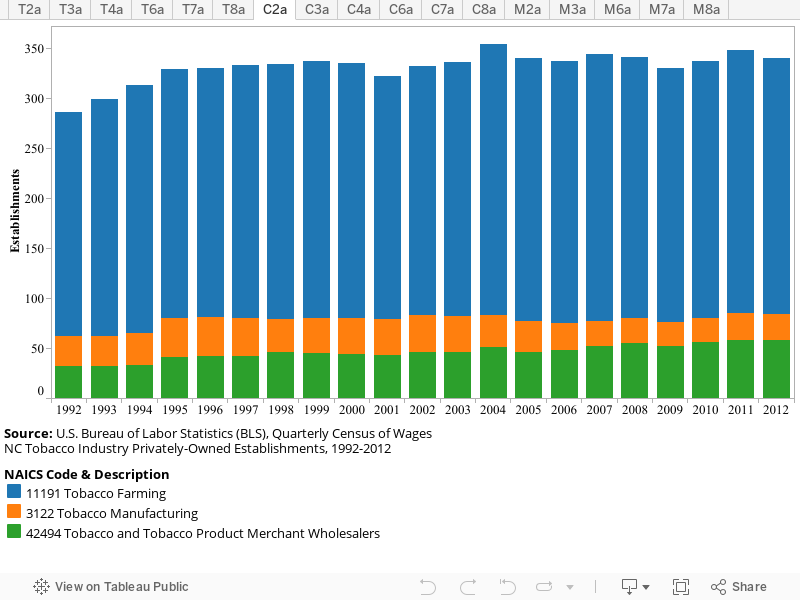
Table 2a: NC Establishments | Map 2a: NC Establishments
Tobacco: Chart 2b: US Establishments: 1992-2012
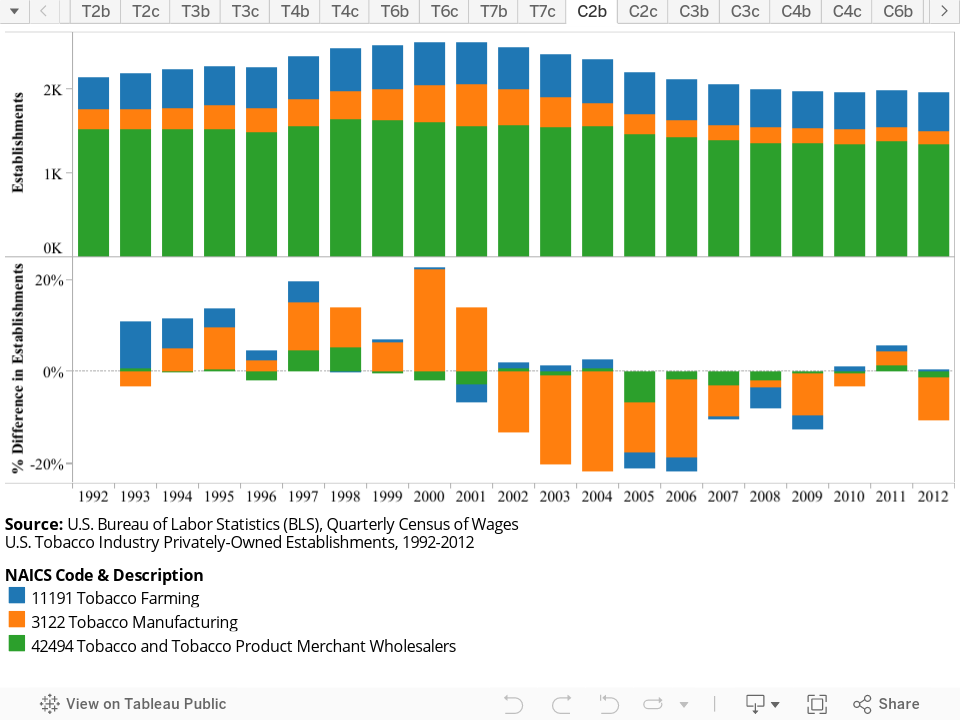
Table 2b: U.S. Establishments | Map 2b: U.S. Establishments
Tobacco: Chart 2c: U.S. Establishments (by State): 1992-2012
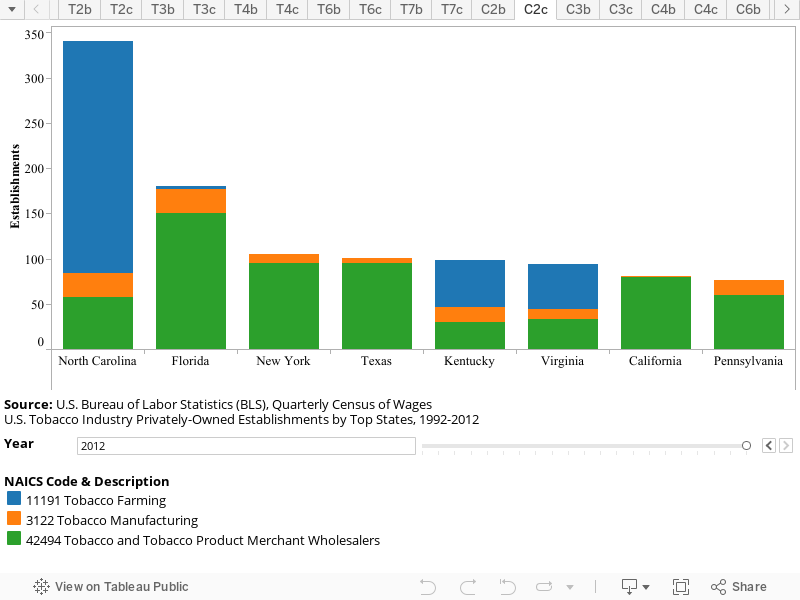
Table 2c: U.S. Establishments (By State) | Map 2c: U.S. Establishments (By State)
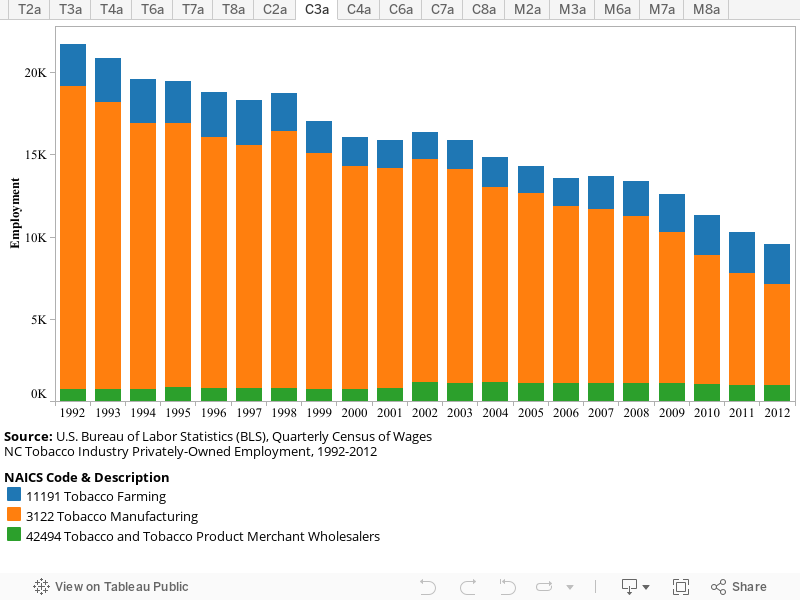
Tobacco: Chart 3a: NC Employment: 1992-2012
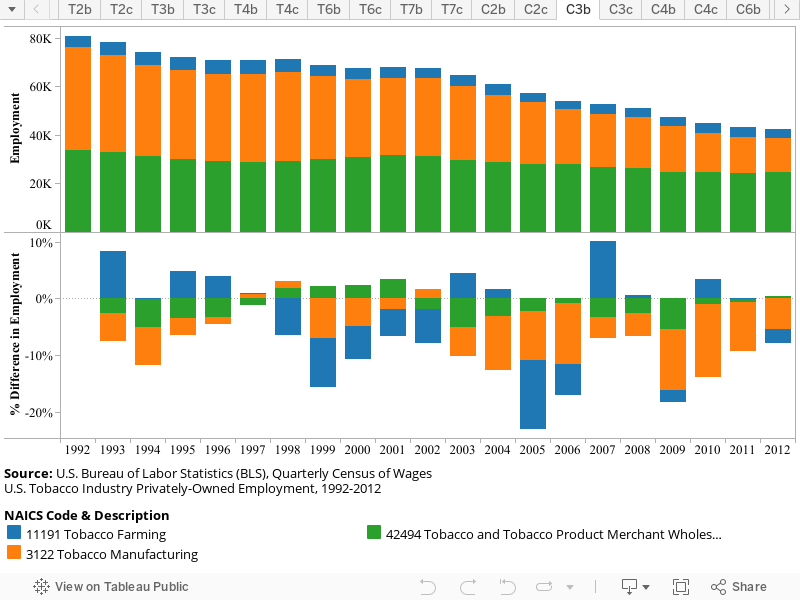
Tobacco: Chart 3b: US Employment: 1992-2012
Tobacco: Chart 3c: U.S. Employment (by State): 1992-2012
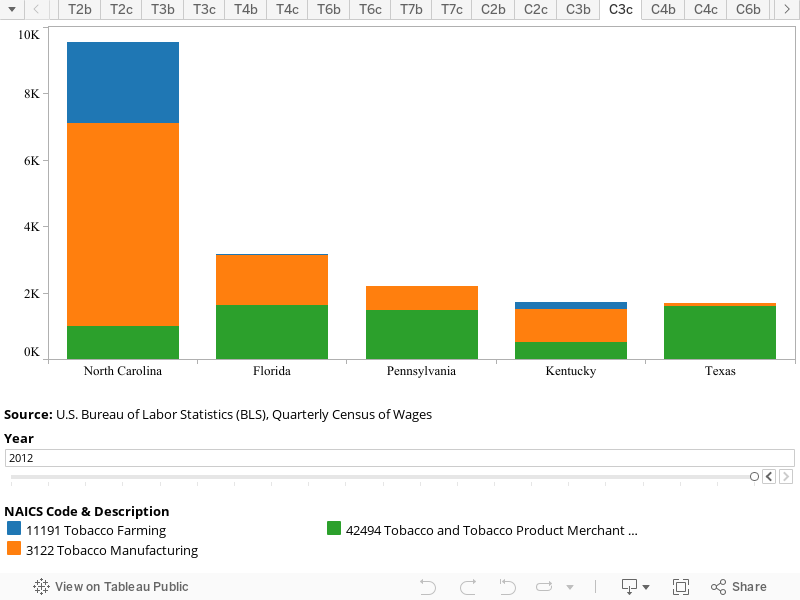
Table 3c: U.S. Employment (By State) | Map 3c: Top US Employment By State
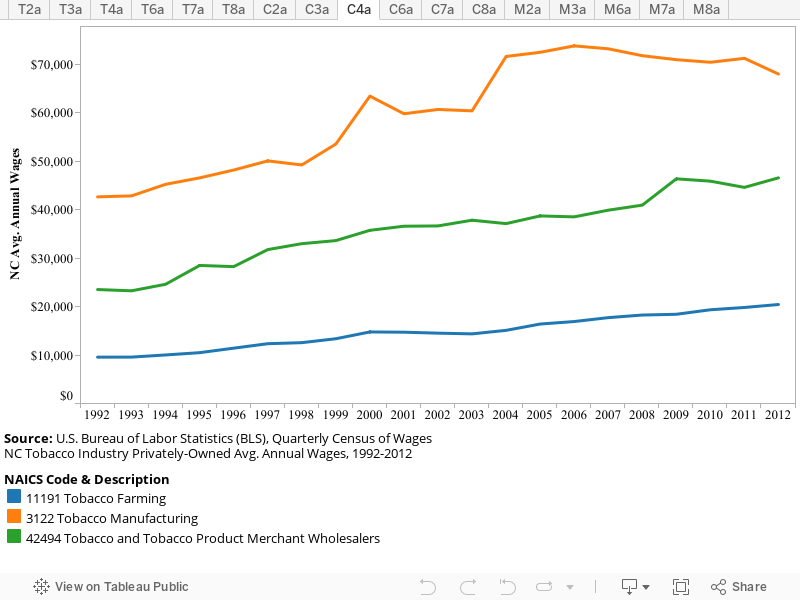
Tobacco: Chart 4a: NC Avg. Annual Wages: 1992-2012
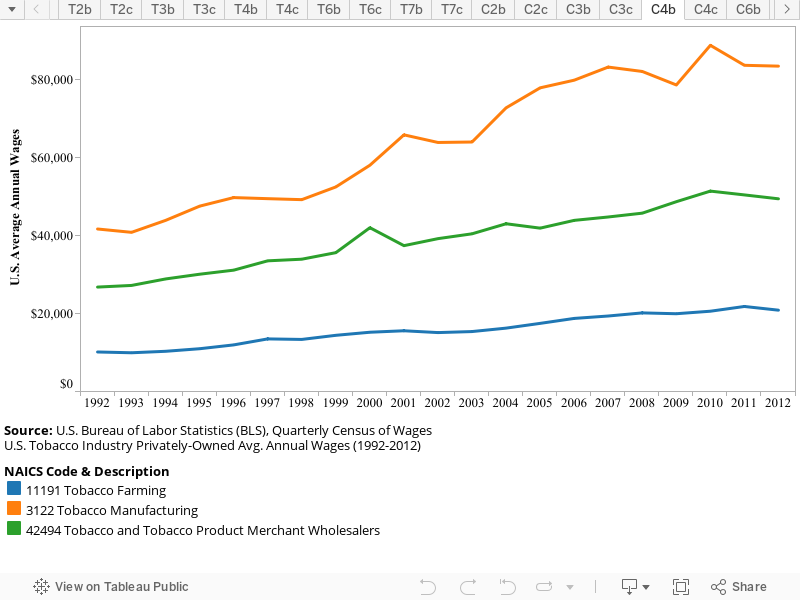
Tobacco: Chart 4b: US Avg. Annual Wages & % Change: 1992-2012
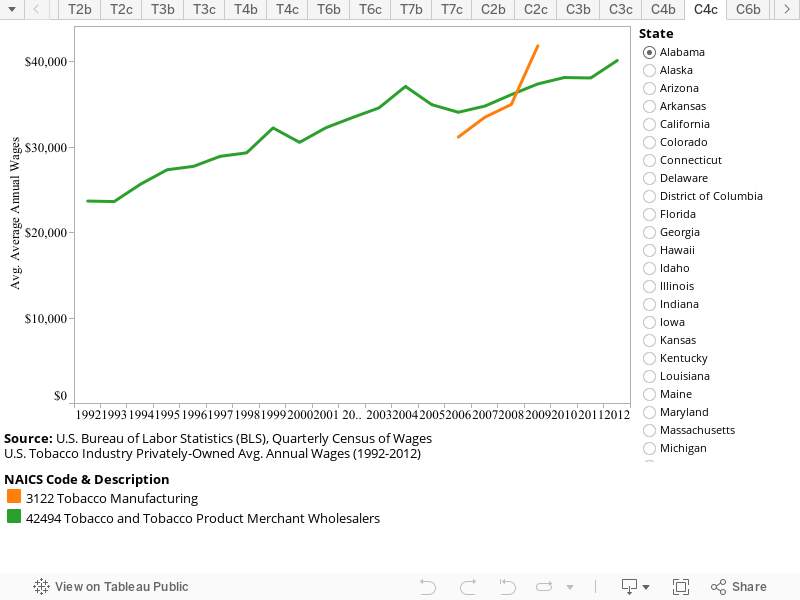
Tobacco: Chart 4c: U.S. Average Annual Wages (by State): 1992-2012
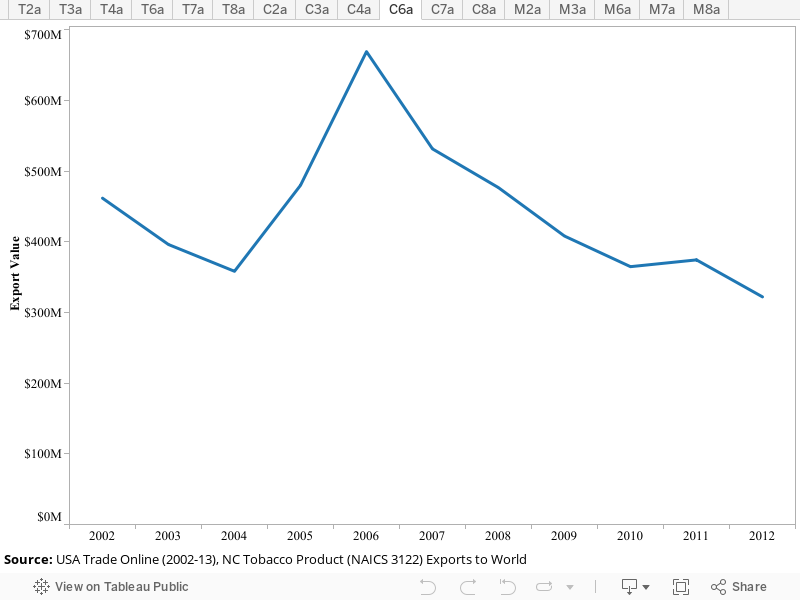
Tobacco: Chart 6a: NC Exports Destinations: 2002-2012
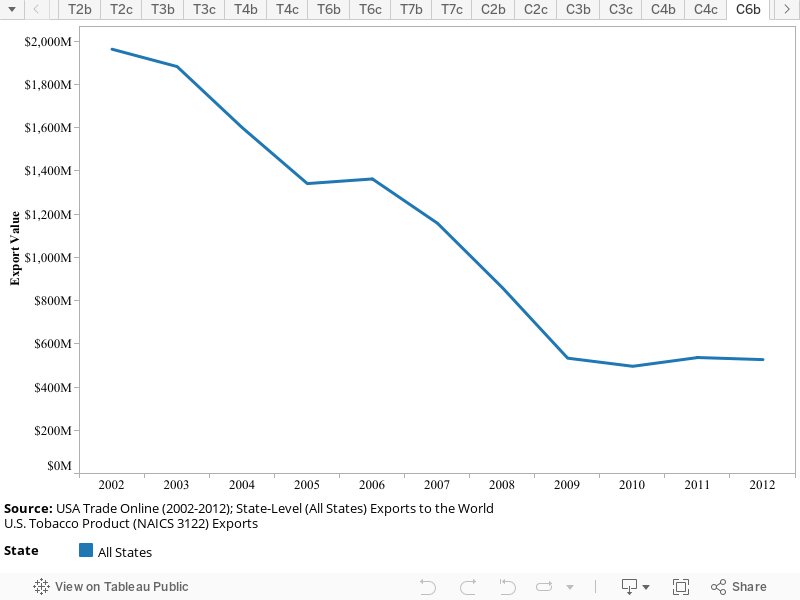
Tobacco: Chart 6b: US Export Destinations: 2002-2012
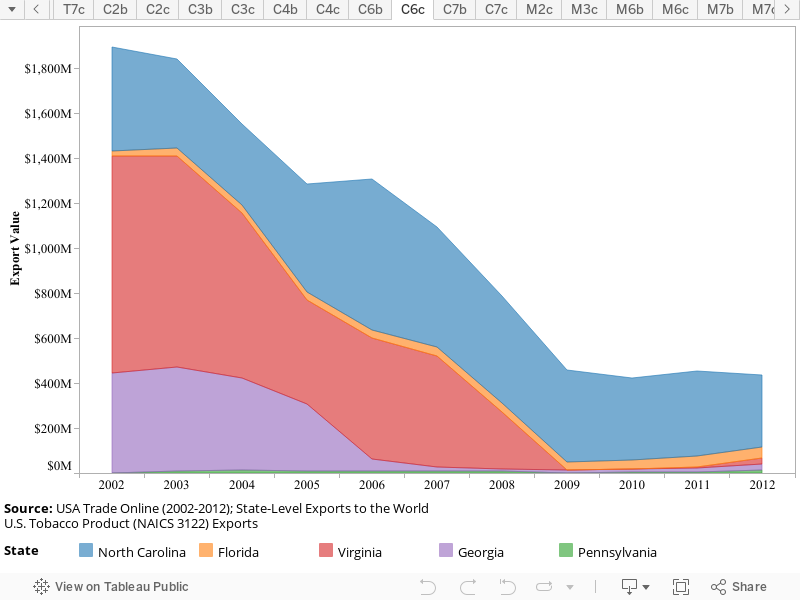
Tobacco: Chart 6c: U.S. World Exports by State: 2002-2012
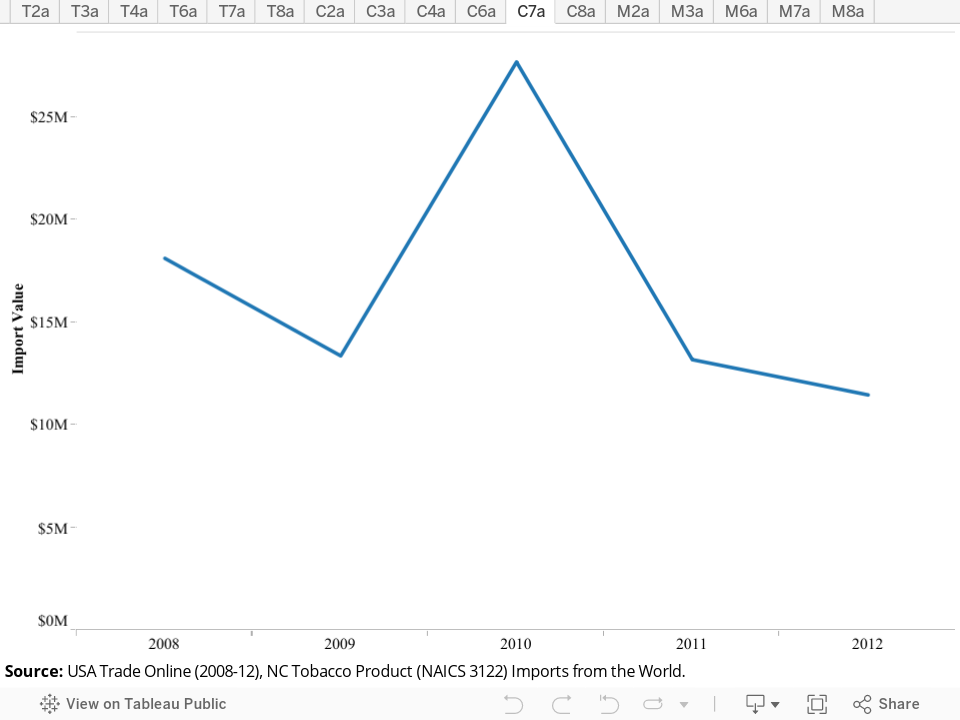
Tobacco: Chart 7a: NC Import Countries: 2008-2012
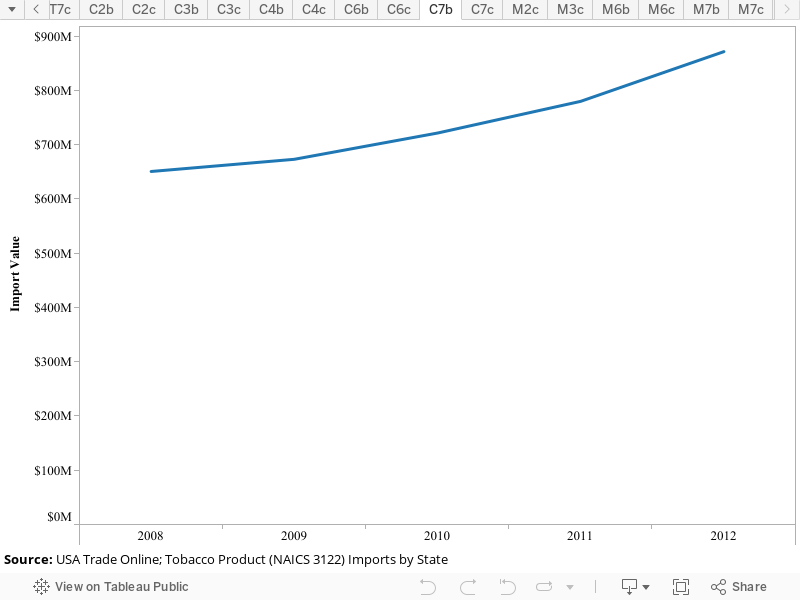
Tobacco: Chart 7b: US Import Countries: 2008-2012
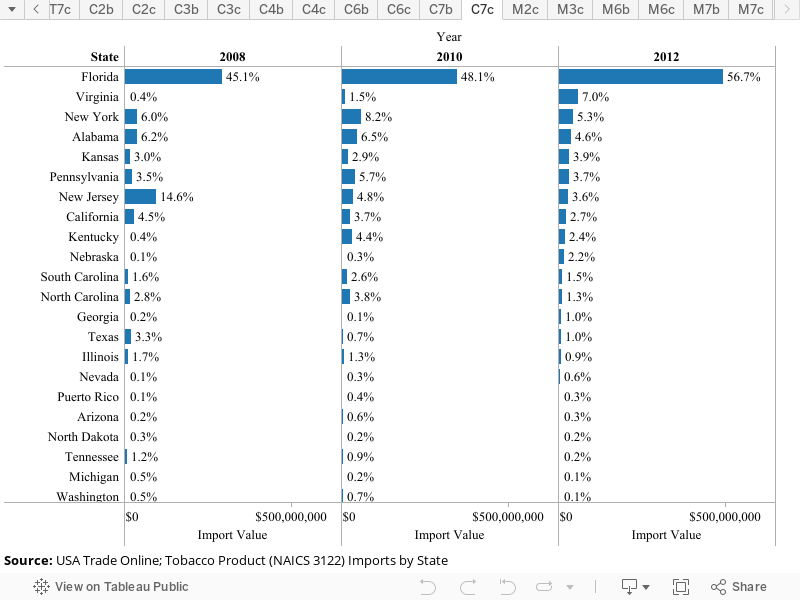
Tobacco: Chart 7c: U.S. World Imports by State: 2008-2012
Tobacco: Chart 8a: NC Layoffs & Closings: 1989-2013
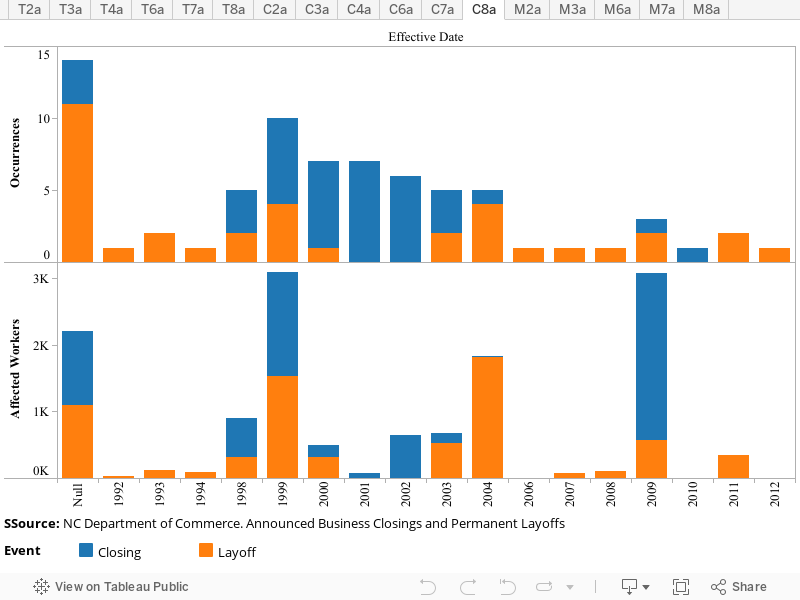
Table 8a: NC Layoffs & Closings | Map 8a: NC Layoffs & Closings: Affected Workers By County