Tables
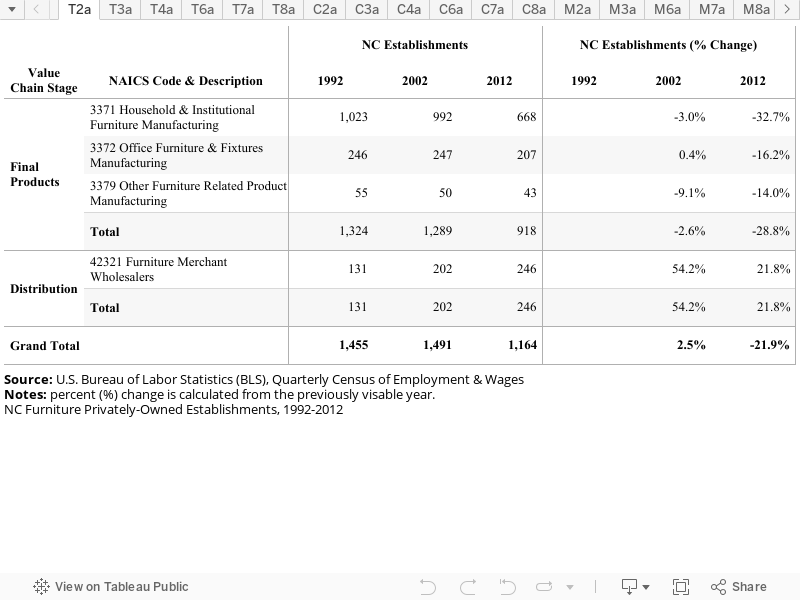
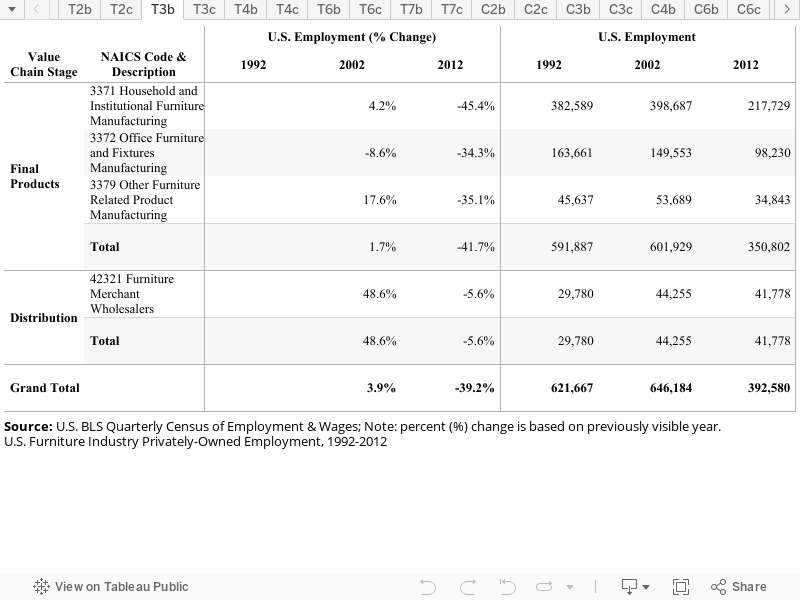
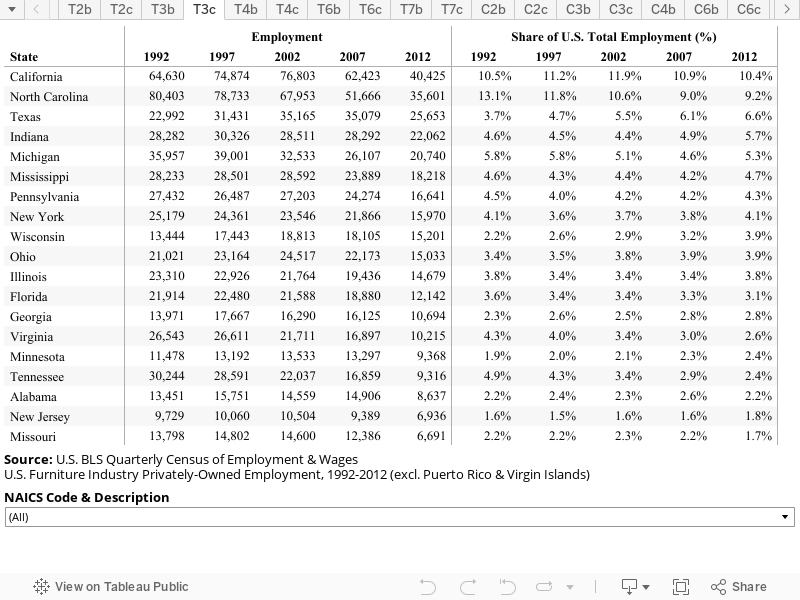
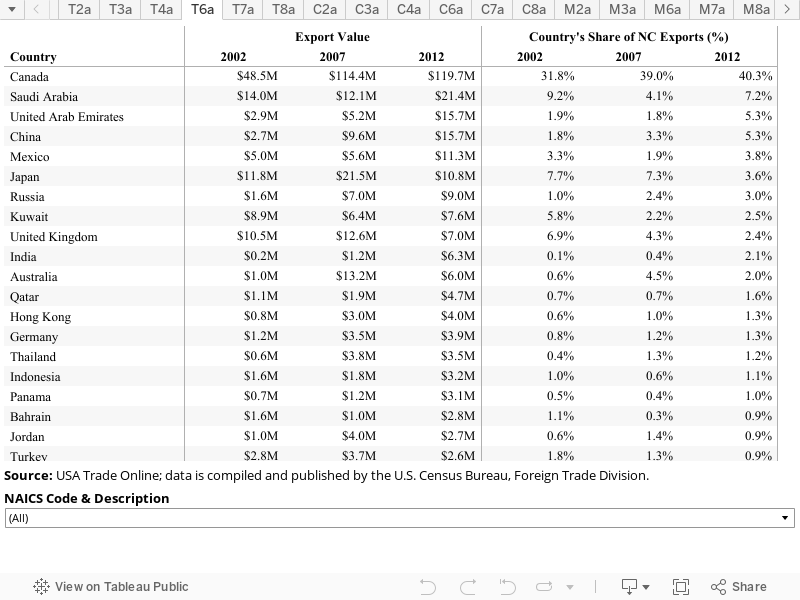
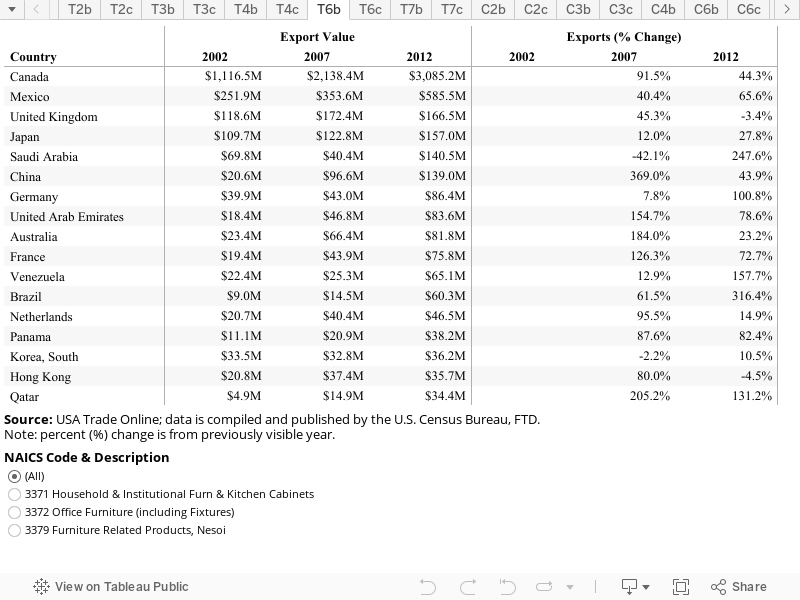
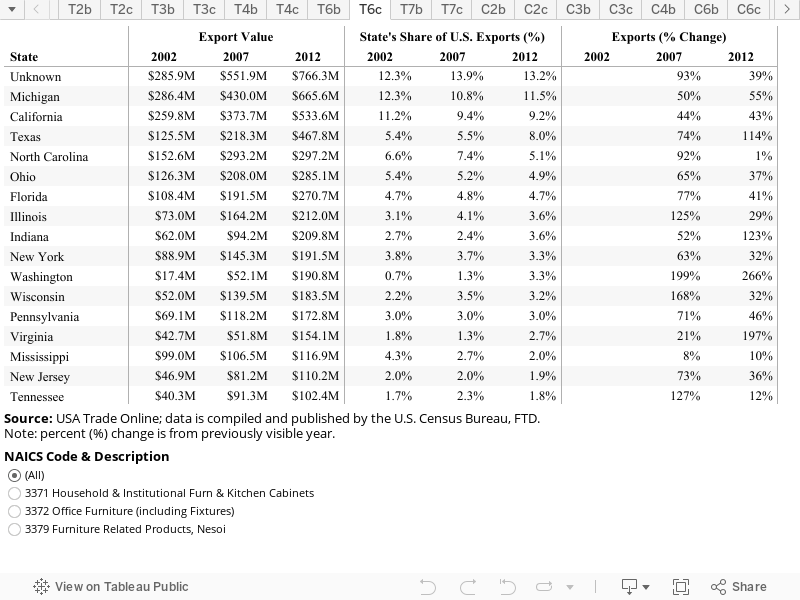
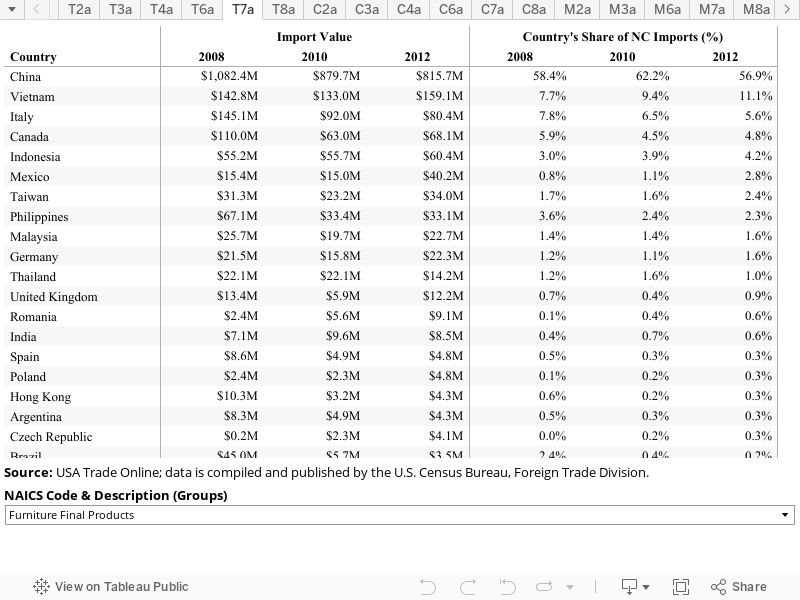
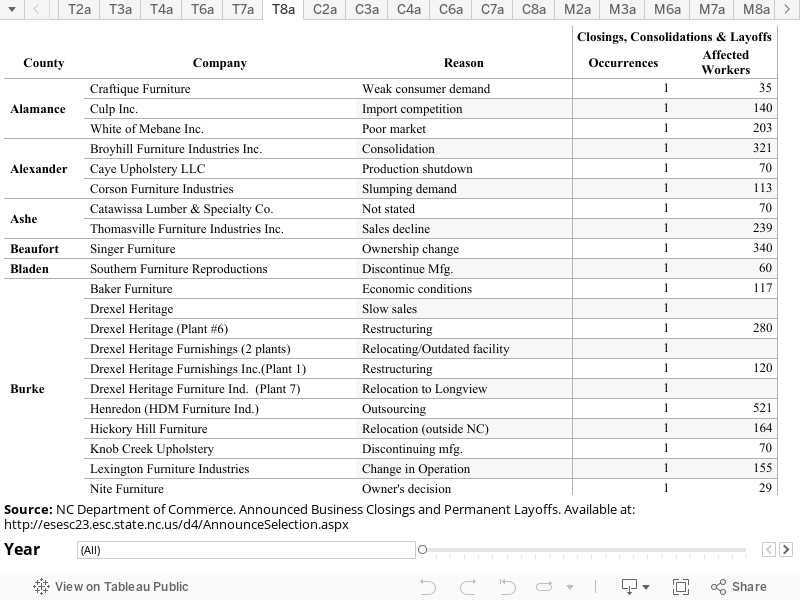
This page includes data in table format on various topics for the furniture industry. These tables are referenced with hyperlinks throughout the other sections of this industry, but are also all listed here for comparative purposes. The labeling system for the tables, charts and maps as follows is the same for each industry in which information is available: establishments (T2), employment (T3), average annual wages (T4), exports (T6), imports (T7) and layoffs/plant closings (T8) for North Carolina (Table "a"), the United States (Table "b") and top U.S. states (Table "c''). See the “Website Overview” for more details.
Furniture: Table 1a: NC Top Employers
| Rank | Company Name | Headquarters | Primary NAICS | NC Locations | NC Employment | Total Employment | Total Sales |
|---|---|---|---|---|---|---|---|
| 1 | Furniture Brands International, Inc. | St. Louis, MO | 337122 | 23 | 4,500 | 9,100 | $1,072 |
| 2 | Klaussner | Asheboro, NC | 337121 | 3 | 1,770 | 2,100 | $123 |
| 3 | CV Industries, Inc. | Hickory, NC | 337122 | 9 | 1,658 | 2,100 | $127 |
| 4 | Sherrill Furniture Company | Hickory, NC | 337121 | 7 | 1,400 | 1,400 | $93 |
| 5 | Bernhardt Industries | Lenoir, NC | 337122 | 6 | 925 | 1,200 | $73 |
| 6 | La-Z-Boy Inc. | Monroe, MI | 337121 | 8 | 780 | 8,185 | $1,333 |
| 7 | Ethan Allen Interiors Inc. | Danbury, CT | 337122 | 2 | 680 | 4,900 | $729 |
| 8 | Mitchell Gold + Bob Williams | Taylorsville, NC | 337121 | 2 | 600 | 750 | $45 |
| 9 | Stanley Furniture Company, Inc. | High Point, NC | 337122 | 3 | 570 | 549 | $99 |
| 10 | Tempur Sealy International, Inc. | Lexington, KY | 337910 | 8 | 555 | 1,950 | $1,403 |
| 11 | Lexington Home Brands | Thomasville, NC | 33712 | 2 | 520 | 3,000 | $208 |
| 12 | Steelcase Inc. | Grand Rapids, MI | 337214 | 2 | 505 | 10,400 | $2,869 |
| 13 | McCreary Modern, Inc. | Newton, NC | 337121 | 2 | 485 | 600 | $34 |
| 14 | Kewaunee Scientific Corp. | Statesville, NC | 337127 | 1 | 455 | 10,400 | $117 |
| 15 | Kohler Co. | Kohler, WI | 327110 | 4 | 410 | 30,000 | $4,169 |
Sources: Dun & Bradstreet’s Hoover’s Online Pro database, secondary news sources and personal communication. Total sales and total employment represent data for the entire corporation. See the FAQ question for additional details.